Statistics
The Statistics tab contains all the information about time spent on device sessions and bookings. The tab has three sections: Daily distribution, Users and Devices.
Daily distribution
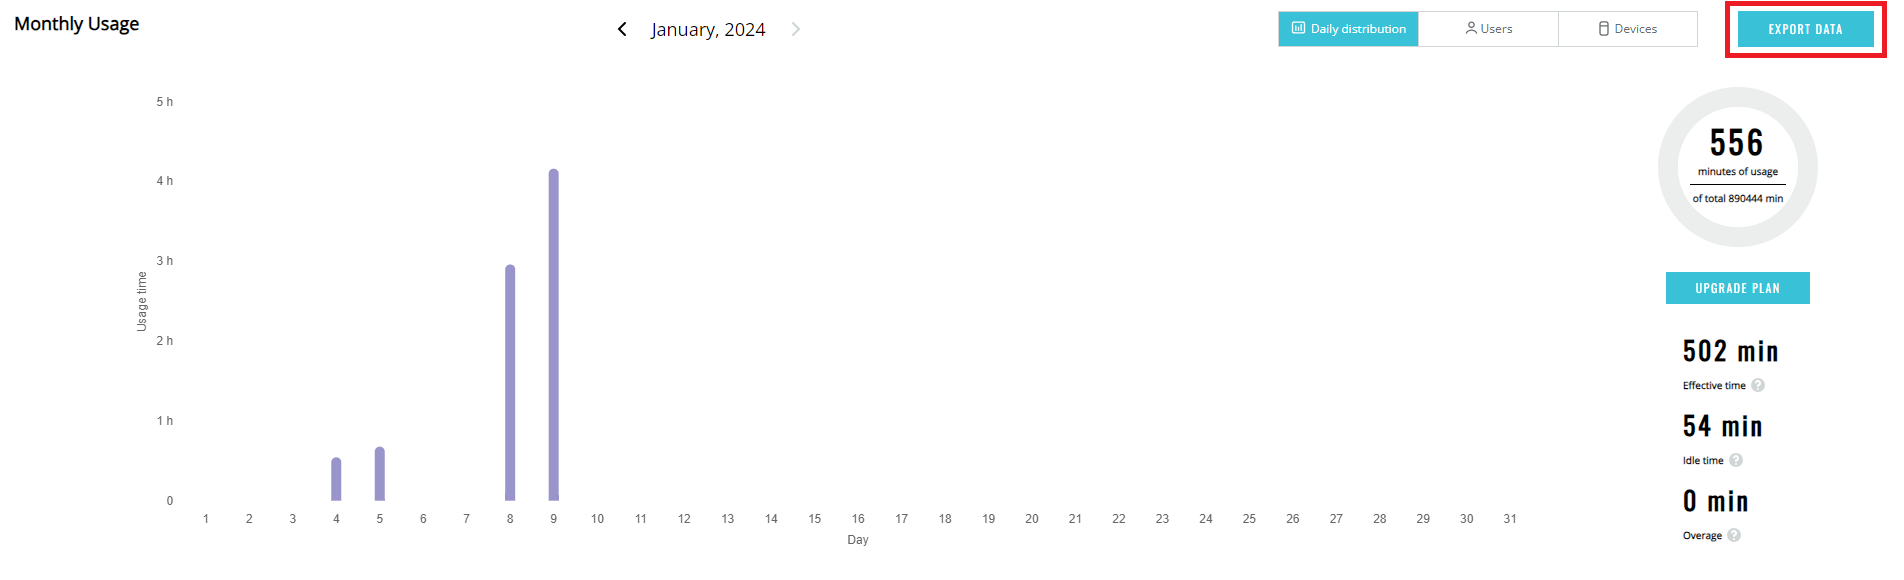
In this section, you can see how much time you spend daily and in total.
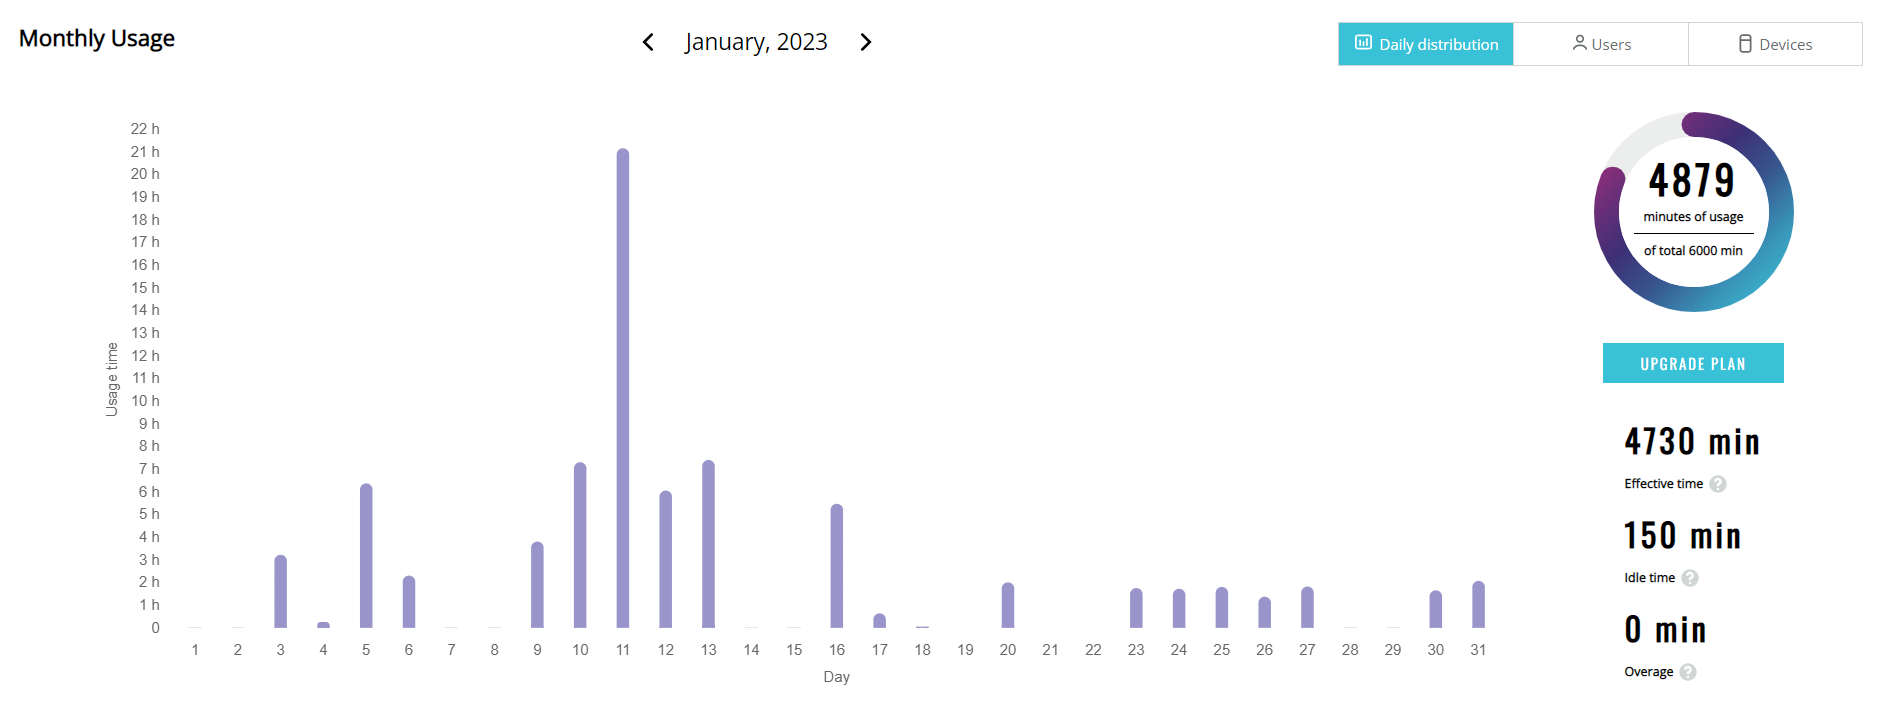
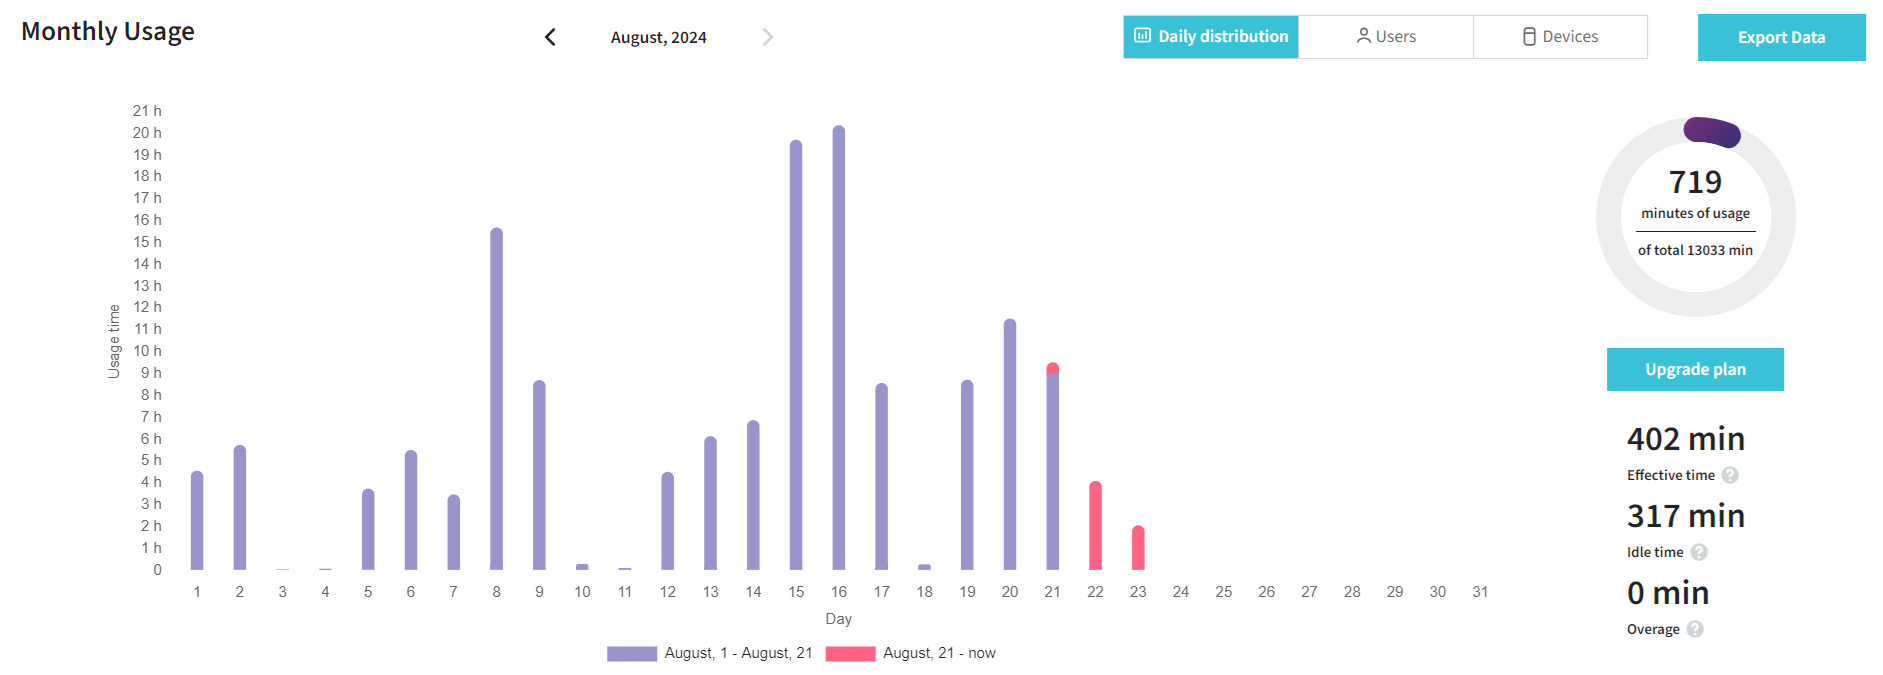
If you hover over the purple lines in the Usage time/Day graph, you can see usage in device sessions per day:
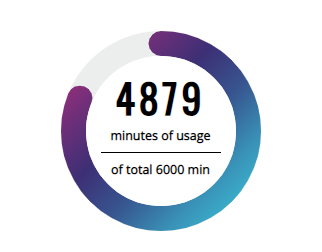
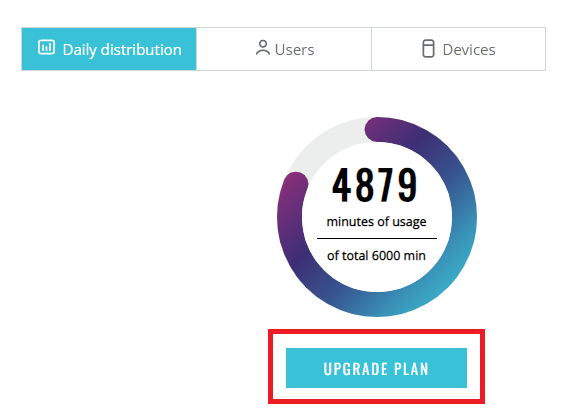
The next element is a Doughnut chart. It shows how much time you have in your subscription plan and what part of the plan you spent:
With the help of the Upgrade plan button, you can initiate the process of changing the subscription plan you are having now.
If you want to understand what time was spent on sessions and bookings or whether the team has exceeded the subscription package quota, you should look at the detailed breakdown:
- Effective time – time spent on device sessions only.
- Idle time – time spent in bookings when a booking has started but the device is not in use.
- Overage – time that exceeds the plan quota.
Every option has a question icon in the breakdown. You can hover over the icon to check the option explanation.
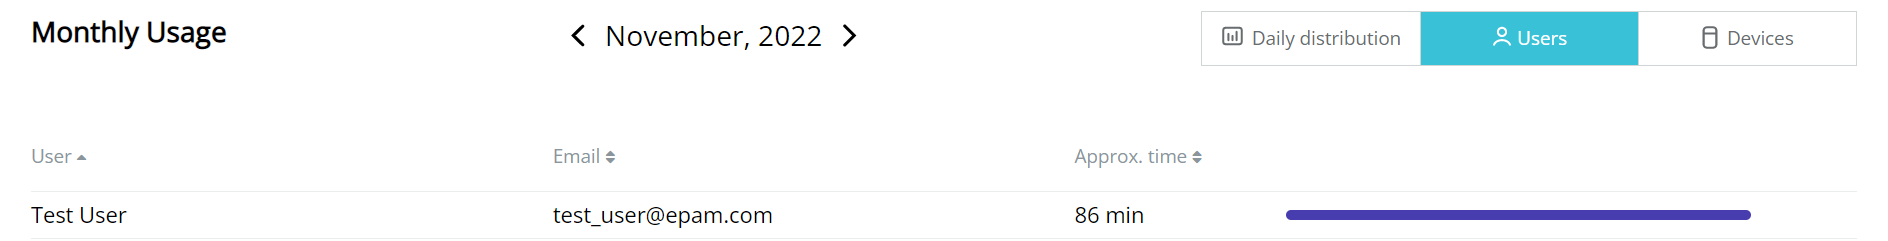
Users
The Users tab provides your usage time if you are under a Personal account and your team’s if you are under a Team account.
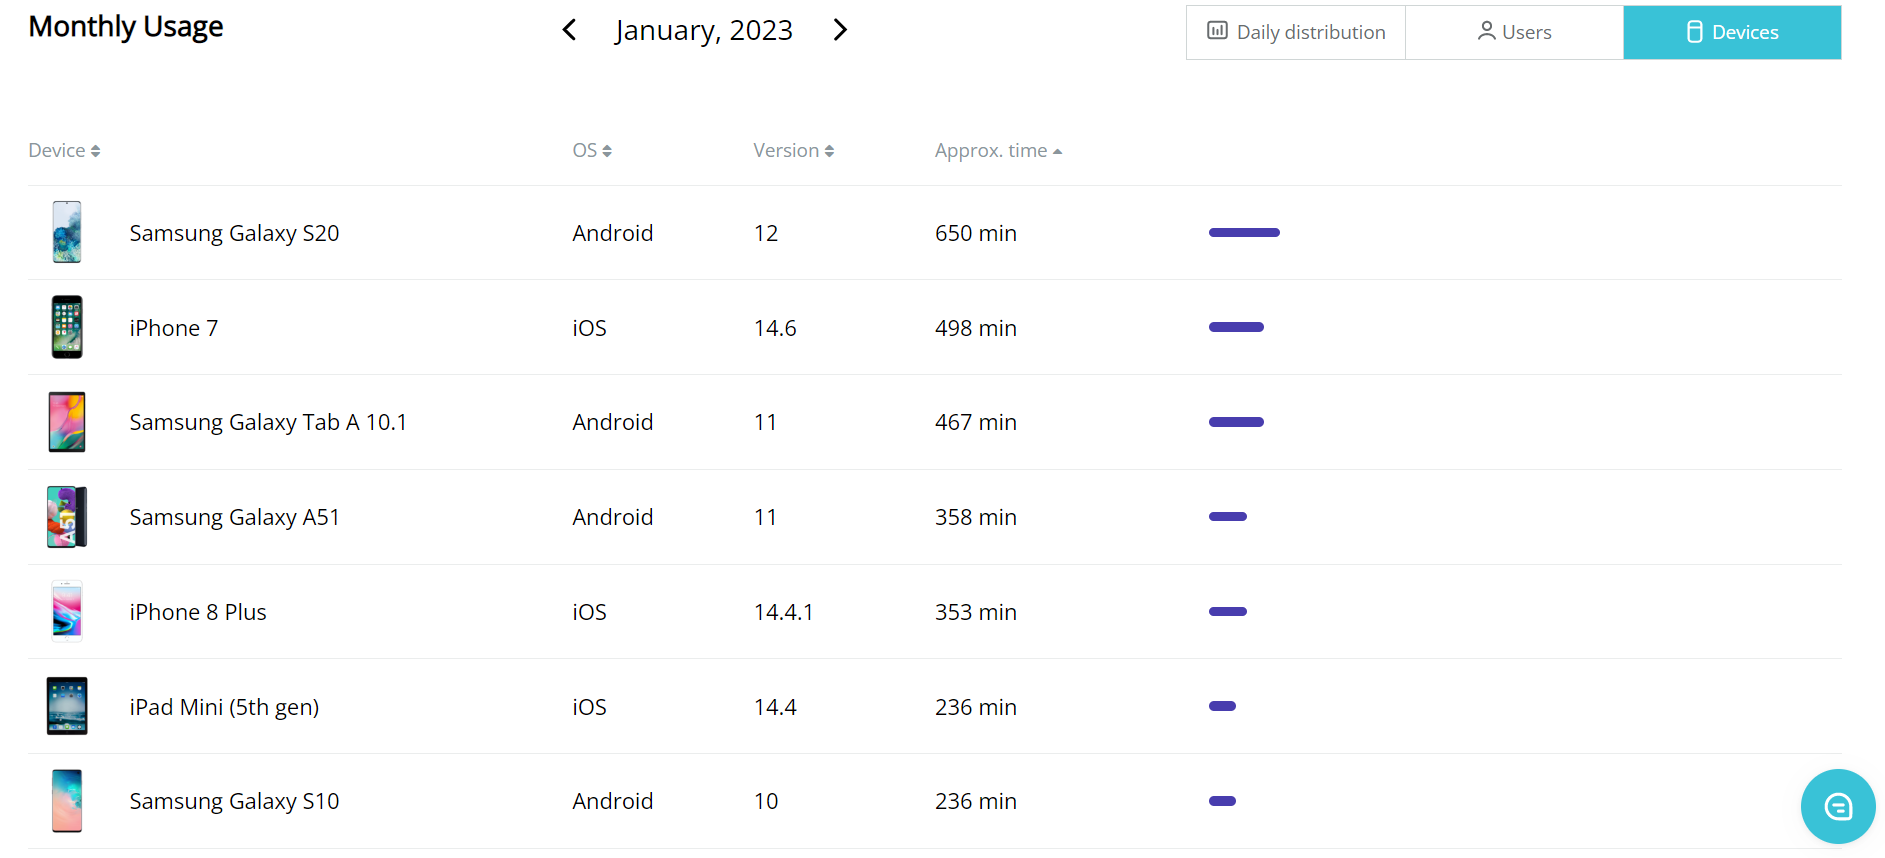
Devices
If you need to check what devices are popular for usage, you should navigate to the Devices tab in Statistics.
Data export
The Daily distribution, Users and Devices tabs have the Export data buttons. You can click on them and download a \.csv file with the usage information. Note that if you need data from every tab, it is necessary to open every tab and click on the button in them.
Other months data
To check usage data for other months, you can open a calendar or use navigation arrows.
Subscription change
If anything has changed in your subscription, you will see that the new usage data have another color. Also, a date appears under the Daily distribution graph.