Console mode
After downloading and installing Mobitru Connect, you can run it in the Console mode. For macOS and Linux, the Console and UI applications are one file, while there are two separate files for Windows.
There are two ways to start the application from a console application:
- .env file.
- parameters typing directly in the console.
Start with .env file
You should follow the steps to start Mobitru Connect in the Console mode with the help of the .env file:
- Prepare the .env file with these parameters:
- HOST: URL of the platform where you use the Remote debugging feature.
- API_KEY: your access key.
- AUTO_CONNECT: a boolean flag to activate the auto-connect mode
- ADB_PORT: the parameter is optional. 5038 is the default port.
- LT_PROXY: the parameter is optional and needed for Proxy. If the feature is needed, use “http://127.0.0.1:8888”. Leave empty and do not type in the .env file, if not needed.
- LOG_LEVEL: the parameter is optional. To see debug logs, you should type “debug”.
Example of the file: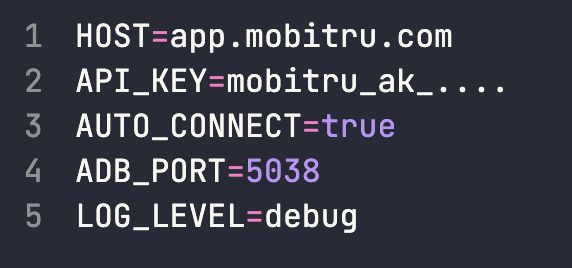
- Place the .env file in the same folder where the Mobitru Connect application is kept.
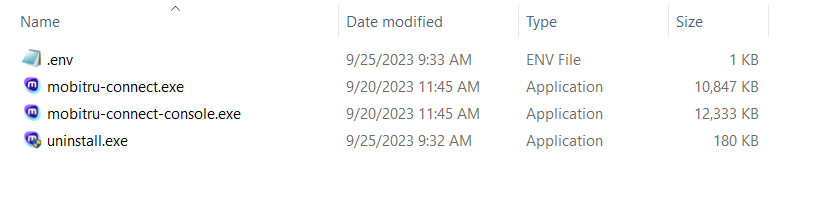
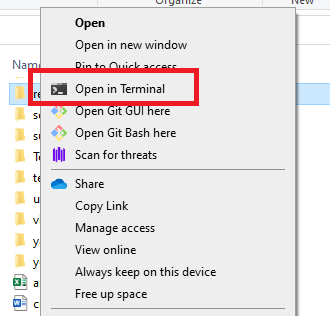
- Open the folder with .env and application in a Console/Terminal application.
- In the Terminal, run a command of the feature you need:
Remote debugging: name_of_the_app --no-ui --remote-debug
Local tunneling: name_of_the_app --no-ui --local-tunnel
Proxy: name_of_the_app --no-ui --local-tunnel

Example for Windows: mobitru-connect-console.exe --no-ui --local-tunnel
Example for macOS: mobitru-connect --no-ui --remote-debug- Open the Mobitru platform, and take any device.
- Open your IDE.
- Check the device in the device list.
Start from a Terminal app
- Open the folder with the Mobitru Connect tool in a CMD/Terminal application.
- Paste the command to the CMD/Terminal:
Remote debugging: name_of_the_app --no-ui --remote-debug --auto-connect --api-key YOUR_API_KEY --host HOST_WHERE_DEVICE_IS --adb-port 5038
Local tunneling: name_of_the_app --no-ui --local-tunnel --auto-connect --api-key YOUR_API_KEY --host HOST_WHERE_DEVICE_IS --adb-port 5038
Proxy: name_of_the_app --no-ui --local-tunnel --lt-proxy http://127.0.0.1:8888 --auto-connect --api-key YOUR_API_KEY --host HOST_WHERE_DEVICE_IS --adb-port 5038

Example for Windows: mobitru-connect-console.exe --no-ui --remote-debug --auto-connect --api-key mobitru_ak_S.... --host app.mobitru.com --adb-port 5038- Run the command.
- Open the Mobitru platform, and take any device.
- Open your IDE.
- Check the device in the device list.
Notes for Xcode
For macOS, take into account the following moments:
- Debug symbols will be downloaded for every iOS device you use for the first time for Remote debugging. If you have downloaded the symbols for a device, this step will not appear.
- Open Xcode in the very end after running the Remote debugging command. If you have opened XCode earlier, you will need to reopen it. Otherwise, you will not see the device in the list.